Table des matières
Switch/Router/Firewall/AP interface
General
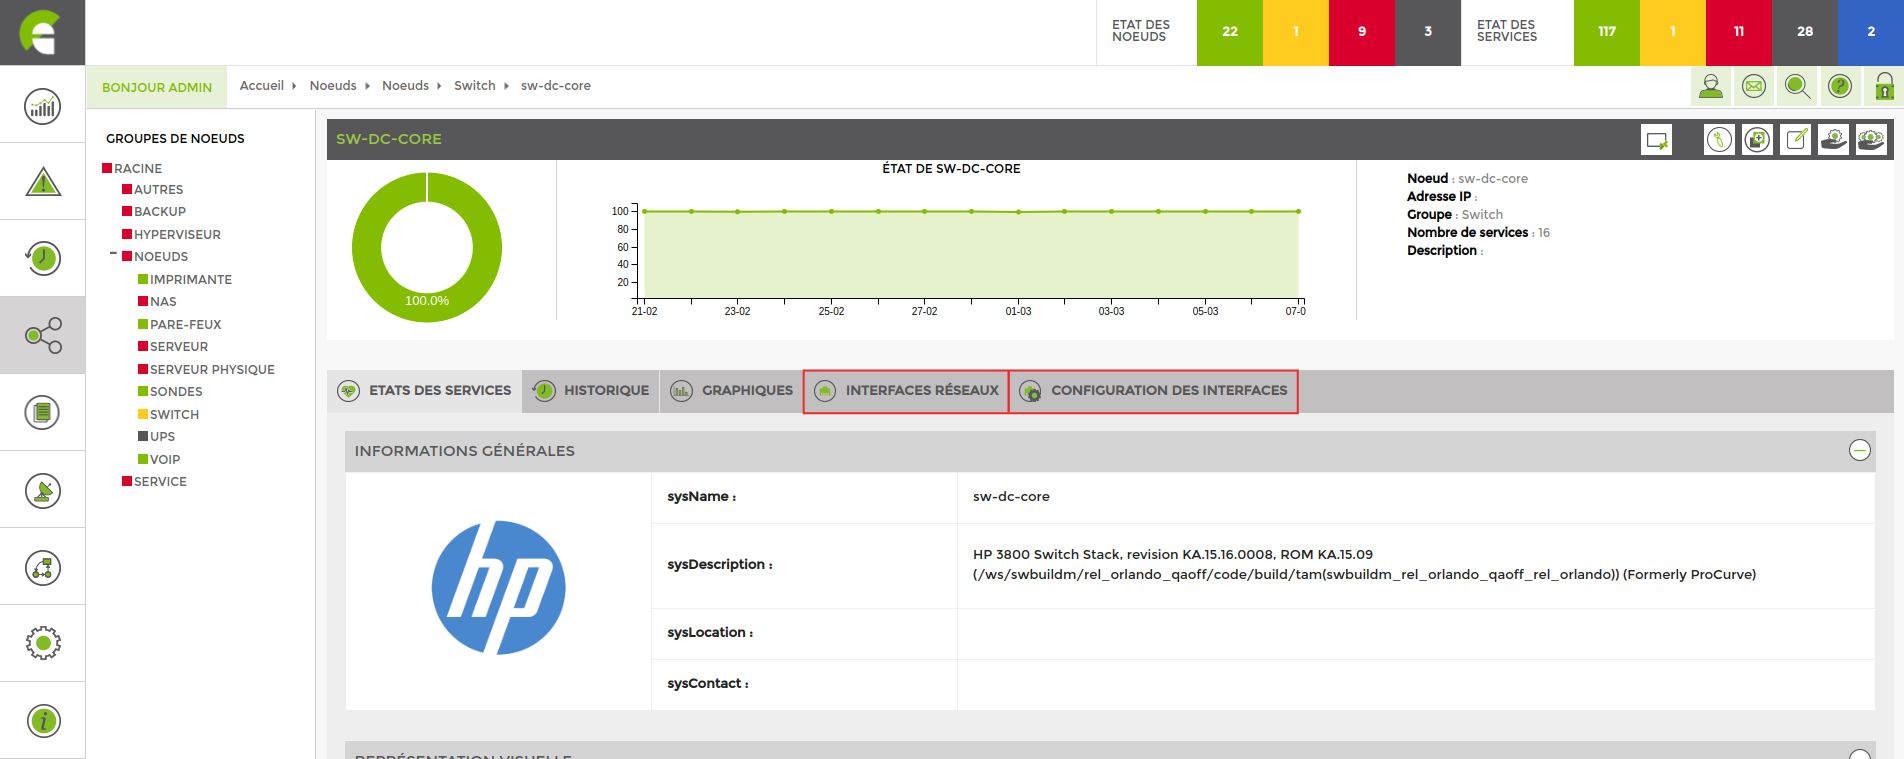
In addition to the information found on the general page of a node, the page for devices such as switches, routers and other similar elements will contain the following information:

- Visual representation of interfaces
- The legend allows you to see the throughput of each interface at a glance
By clicking on an interface, you can access the following information:
Interface graphics

You can choose a start and end date. The services to be displayed and the minimum, maximum and average statistics.
Information on the interface

Adding and configuring interfaces
Two new tabs appear in the horizontal menu:
Network interfaces
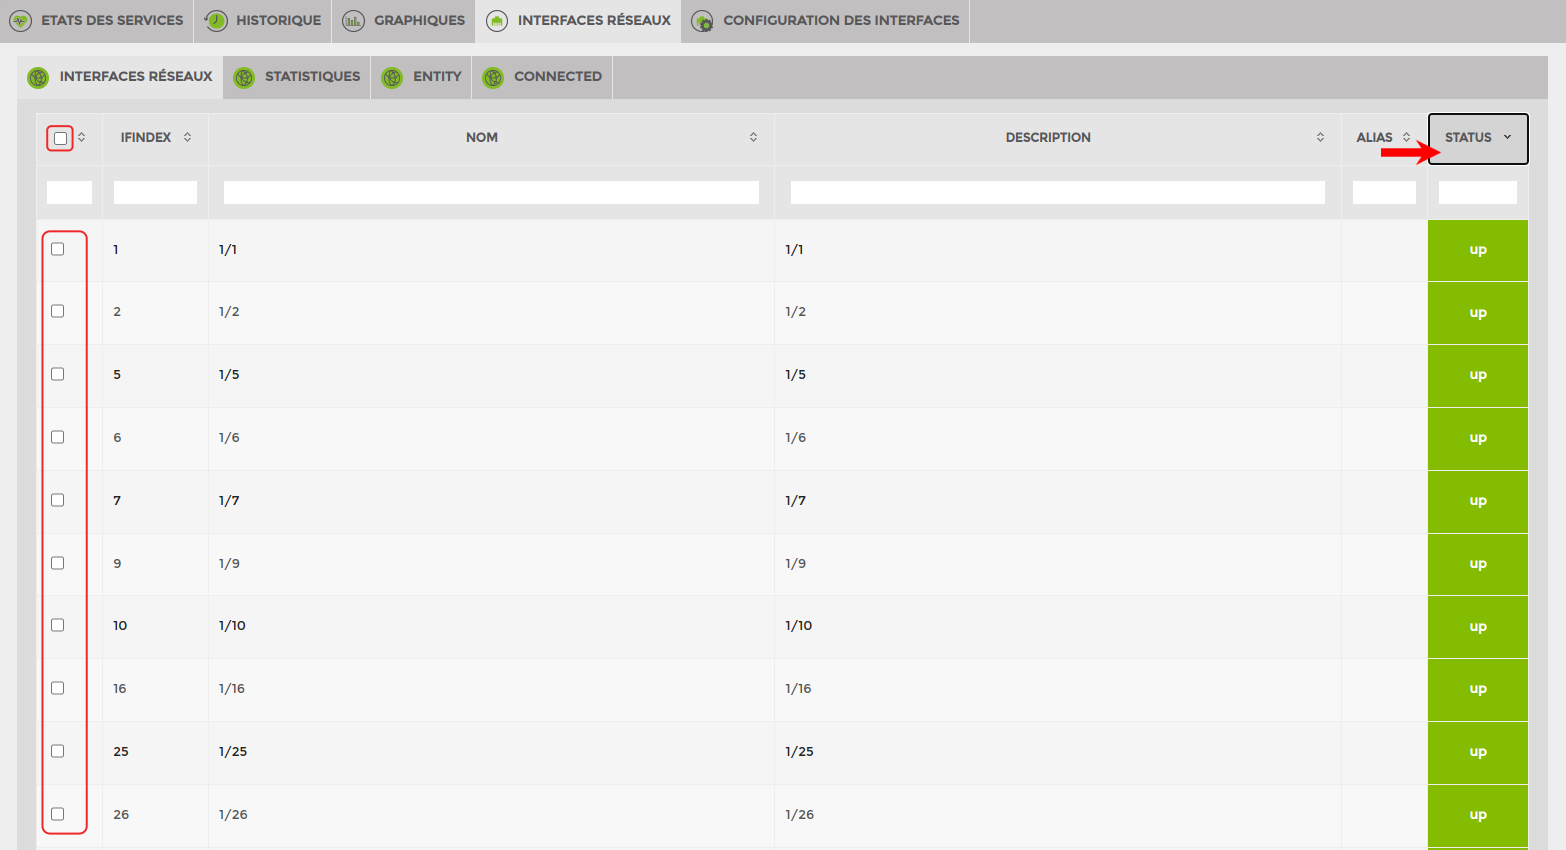
To add interfaces, simply tick the boxes next to them. Then click on add at the bottom of the page. You can sort them by status « up » by clicking on « status » or by typing « up > in the field.
Advanced interface configuration
You can configure an alert on a down interface.
After adding the interface to the list of services. Go to the service parameters for the interface.

If plugin check: add the parameter « -a critical ou warning »

If gesa plugin: add parameter « critical ou warning ».
It is important to insert « critical ou warning » at the end of the field.

Test your parameter, the interface should switch to critical or alert.
