Node overview page
A node's presentation page generally looks like the image below:

It displays the following information:
- The overall status of the node
- The node's global availability graph
- Node information in ESIA
- Horizontal menu giving you access to
- Service status
- Alert history
- Service graphs
- Network interfaces
- Network interfaces configuration
- General hardware information
- The visual representation of the device
ESIA will then display all the tests carried out on the node, as in the following example:
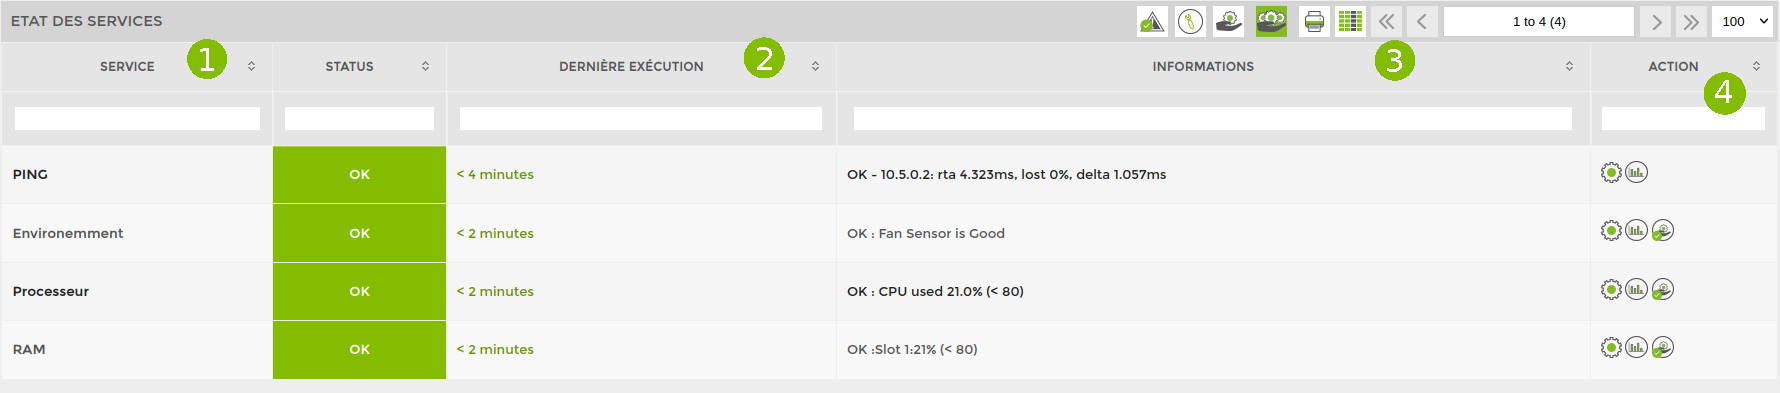
From left to right, you will find :
- The name of the service (the test) and its status (ok, alert, critical, unknown)
- The time of the last execution
- Information reported
- Possible actions
Via the actions column, you can :
 = > Edit test parameters
 = > Acknowledge the alert to indicate that you are working on resolving the problem. This will change the colour of the alert to blue.
 = > Displays a graph of the test with the option of exporting it.
 = > Run the test now
Specific equipment
Some equipment has a different way of presenting its information. Find out more about them in the following sections: