Table of Contents
Blocks
First of all, you need to have added a “canvas” to your reports. See How to create a report.
Availability
Node group, node and service availability
All “availability” blocks are configured in the same way.
- Node group availability
- Node availability
- Service availability
<html><h4>1) Type </h4></html>
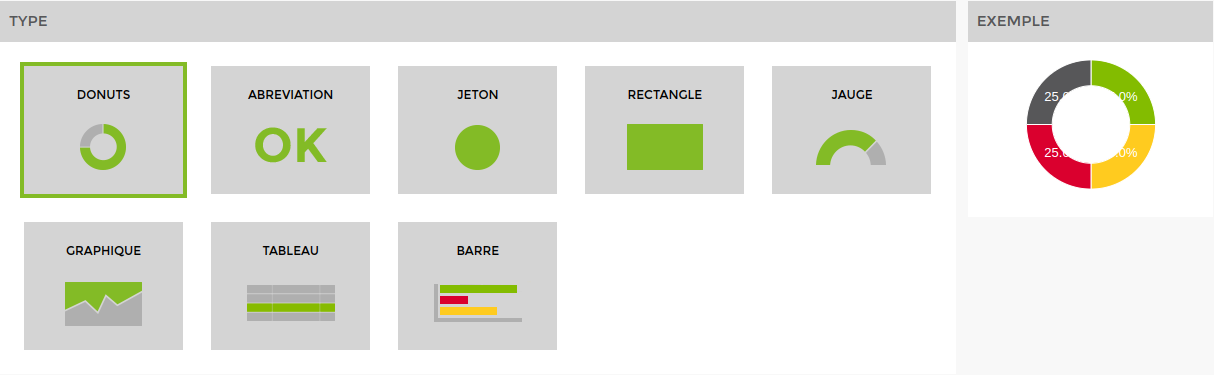
The example on the right is dynamic and will change depending on the block you select to give you a preview. (You can select them one by one to see a preview).
<html><h4>2) Title and description</h4> </html>

Give a title and a description.
<html><h4>3) Linked nodes and configuration</h4> </html>
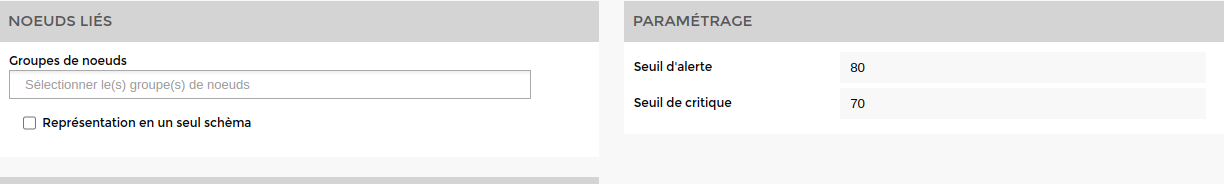
Select the nodenode group of nodes and/or the service. Then set the alert and critical only parameters.
ps: the screen only shows node groups because this is the only part of the block that is slightly different.
<html><h4>4) Impact</h4> </html>

Set the parameters impact.
Choose the types of error involved in calculating availability.
Example: A node with 25% OK, 25% Critical, 25% Alert and 25% Unknown. If you tick all 3 boxes, it will have 25% availability. If only Alert and Critical are ticked, it will have 50% availability. ((100% - 25% Alert) - 25% Critical = 50% availability).
ATTENTION If no box is ticked, this block will always return 100% availability.
Incidents
Node group, node, service and hardware incidents
The next 3 blocks are configured in the same way.
- Node Group Node Group Incident
- Node group nodes
- Service services
Node group, node and service incidents
<html><h4>1) Title and description </h4></html>
Give a title and a description.
<html><h4>2) Linked nodes and alerts identified </h4></html>
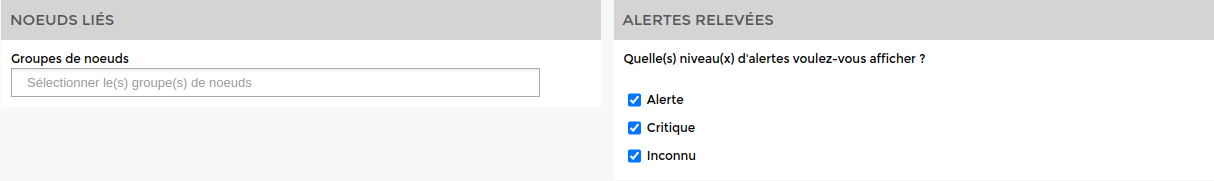
Select the nodenode group of nodes and/or the service. Then set the alerts you want to display.
ps: the screen only shows a group of nodes because this is the only part of the block that is slightly different between these blocks.
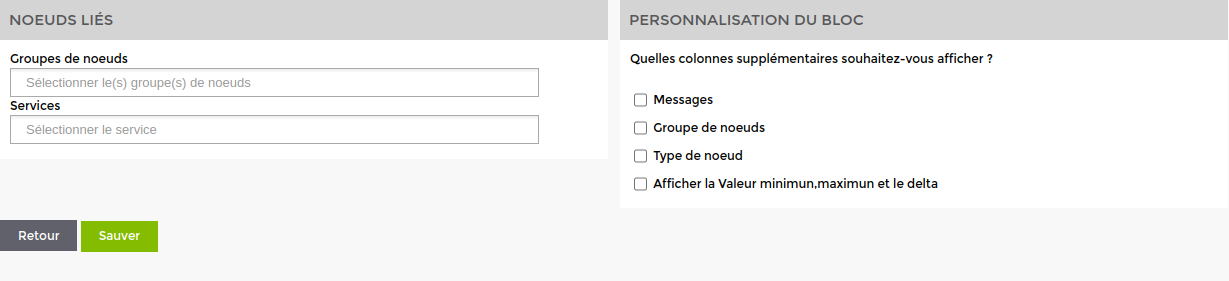
<html><h4>3) Show columns </h4></html>

Display the columns of your choice.
Equipment incidents
<html><h4>1) Title and description </h4></html>
Give a title and a description.
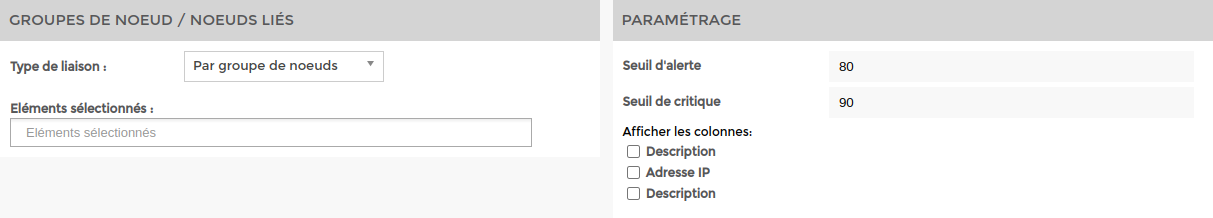
<html><h4>2) Linked nodes and alerts identified </h4></html>

Choose the type of link : group of nodes or nodes and the selected elements. Then set the alerts you want to display.
<html><h4>3) Display columns </h4></html>
Display the columns of your choice.
Resources
Using node group and node resources
Use of node group and nodes are configured in the same way.
<html><h4>1) Title and description </h4></html>
Provide a title and description.
<html><h4>2) Customise the block, parameters and linked nodes </h4></html>

Display the columns you want to appear, set the only alerts and critics and link the block to the node group or nodes.
ps: the screen only shows node groups because this is the only part of the block that is slightly different between these blocks.
Values
Service value (of plugins per node/node group and service per node/node group)
All blocks are configured in the same way.
<html><h4>1) Title and description </h4></html>
Give a title and a description
<html><h4>2) Linked nodes and block customisation </h4></html>
The “linked nodes is slightly different depending on the block. Choose the node group or node and the service if necessary, then add the columns you wish to display.
Other
Service graph
<html><h4>1) Title and description </h4></html>
Give a title and a description.
<html><h4>2) Nodes and links and customising the block </h4></html>
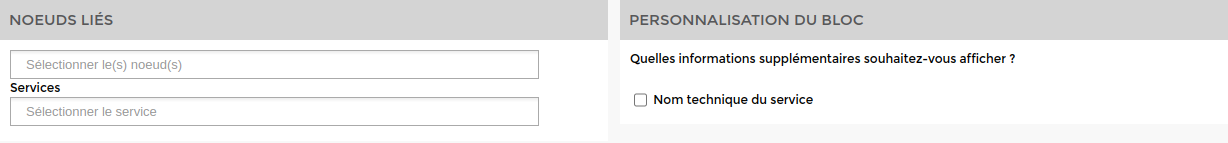
Choose the knot(s) and the service(s) and indicate whether you want to display the technical name of the service.
RGPD register
Give a title and a description.
Connectivity rate
<html><h4>1) Type </h4></html>
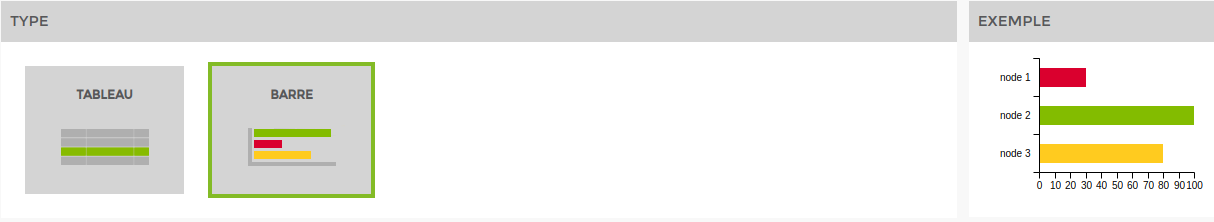
The example on the right is dynamic and will change depending on the widget you select to give you a preview. (You can select them one by one to see a preview).
<html><h4>2) Title and description </h4></html>
Give a title and description.

Text
<html><h4>1) Title and description </h4> </html>
Give a title and a description.
Use of storage spaces
<html><h4>1) Type of storage </h4></html>

The example on the right is dynamic and will change depending on the block you select to give you a preview. (You can select them one by one to see a preview).
<html><h4>2) Title and description </h4> </html>
Give a title and a description.
<html><h4>3) Node group/linked nodes and settings </h4> </html>
Choose whether you want to display by group of nodes or nodes then set the alert threshold and the columns to display.