Table of Contents
Widgets
On this page, you'll find the different types of widgets you can use for your Dashboards.
1 status
View linked to nodes, node groups, plugins or services
The following widgets are configured in the same way:
- View linked to plugins
- View linked to node groups
- View linked to nodes
- View linked to services
Example:

<html><h4>1) Type </h4></html>
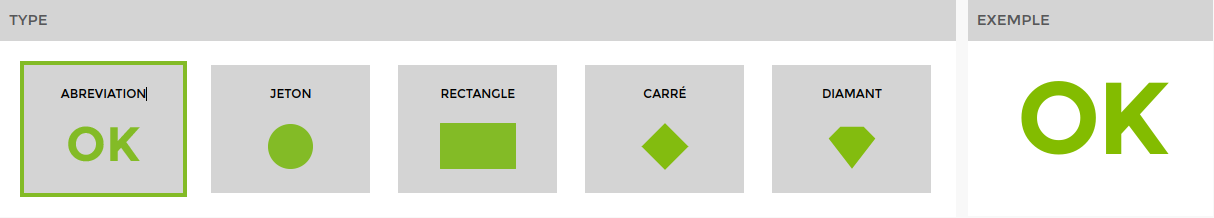 The example on the right is dynamic and will change depending on the widget you select to give you a preview. (You can select them one by one to see a preview).
<html><h4>2) General settings and styles</h4> </html>
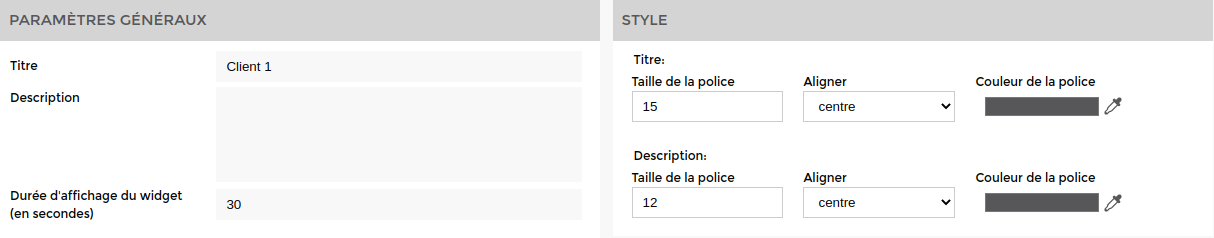
By default, the display time is set to 30 seconds. It is not possible to go below this time.
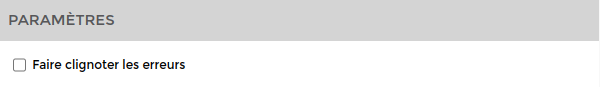
<html><h4>3) Settings</h4> </html>
<html><h4>4) Linked nodes</h4> </html>
4 status
View linked to nodes, node groups, plugins or services
The following widgets are configured in the same way:
- View linked to plugins
- View linked to node groups
- View linked to nodes
- View linked to services
Here's an example:
<html><h4>1) Type</h4></html>
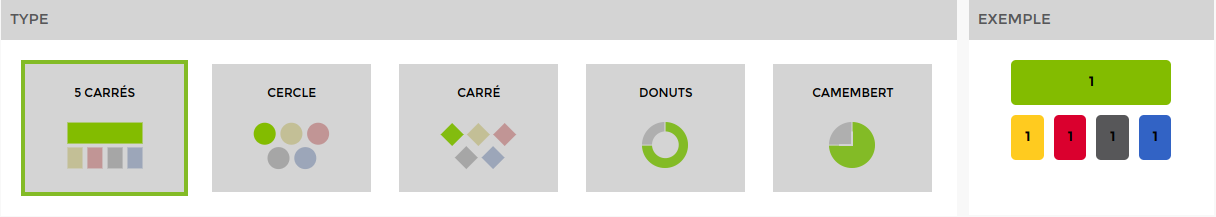 The example on the right is dynamic and will change depending on the widget you select to give you a preview. (You can select them one by one to see a preview).
<html><h4>2) General settings and styles</h4> </html>
By default, the display time is set to 30 seconds. It is not possible to go below this time.
<html><h4>3) Settings </h4></html>
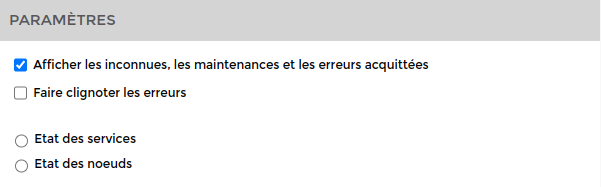
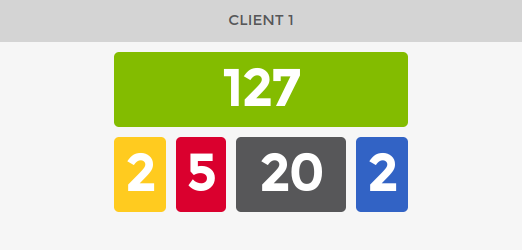
For views linked to nodes or groups of nodes, you can choose to display service status or node status (by default, service status). Node status is the overall status of the nodes (if only one service is critical on the node it will display critical).
Clicking on all nodes or all services will display the status of all nodes or services in your Esia.
Example: On a 5-square view, we select a node that has 3 services in Ok and 1 service in Critical.
- If you select Service Status, 3 will be displayed in the green box and 1 in the red box.
- If node status is selected, 1 will be displayed in the red box (only the node's global status).
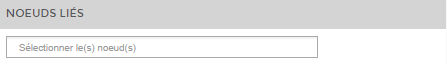
<html><h4>4) Select the linked node(s)</h4></html>
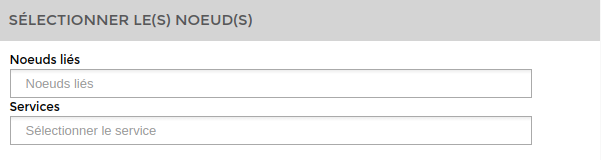
Clicking on the box gives you access to all the nodes available. Choose one or more to add to your dashboard.
Table
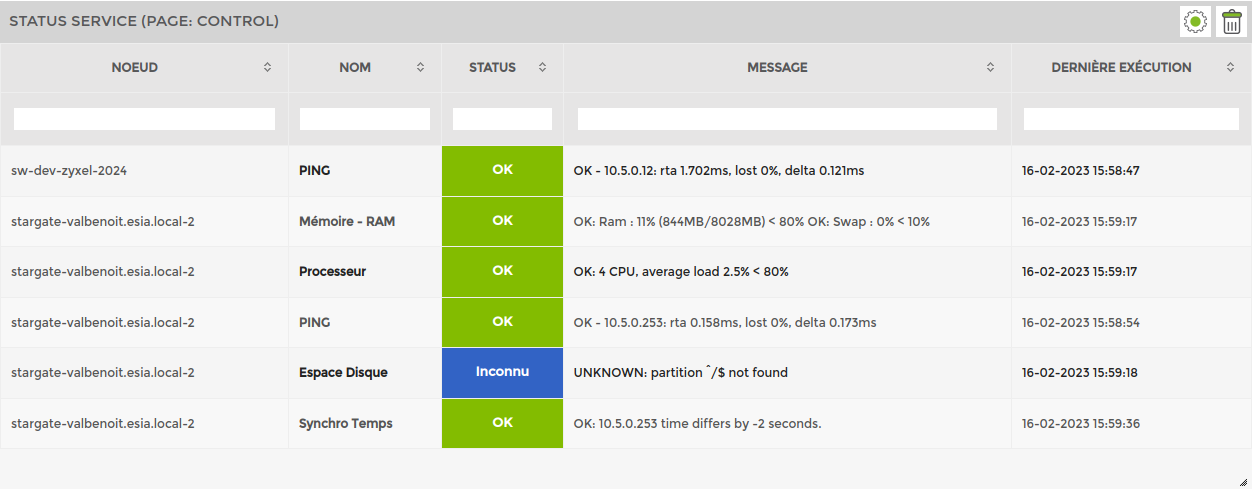
Status service (page:control)
This widget displays the status, service, last execution and a short description of a node.
Example:
<html><h4>1) General settings and styles</h4></html>

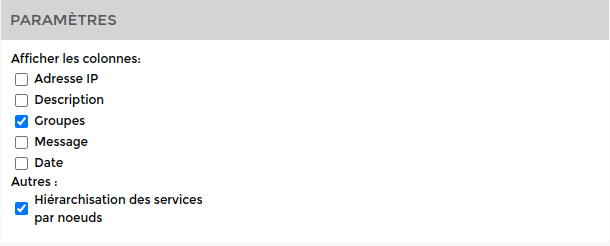
<html><h4>2) Display parameters</h4></html>

You can choose whether or not to display the « Groupes de noeuds », « Message », « Dernière exécution ».
<html><h4>3) Select the node types</h4></html>

Select the nodes and the services to display
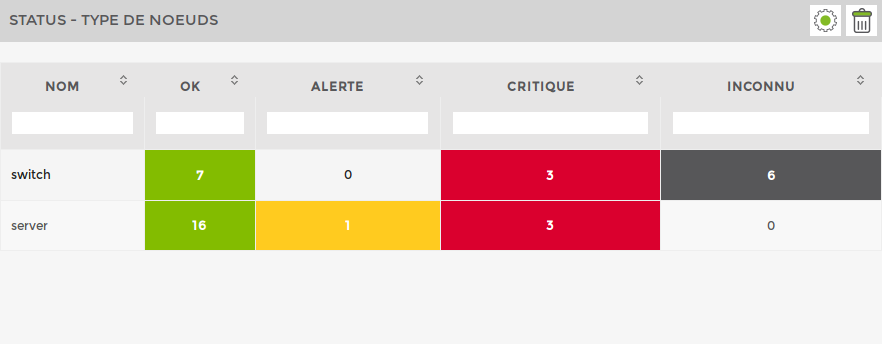
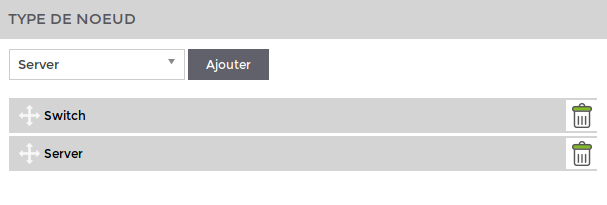
Status - node type
This widget displays the status (Ok, Alert, etc.) of all services applied to all nodes of a given type (servers, etc.).
Example :
<html><h4>1) General settings and styles</h4></html>
<html><h4>2) Display parameters</h4></html>

You can choose whether or not to display the alert, critical and columns. unknown.
You can also switch to status-only display mode. This will only display the number of services in critical compared with the number of services in ok. It does not take into account services in alert and unknown.
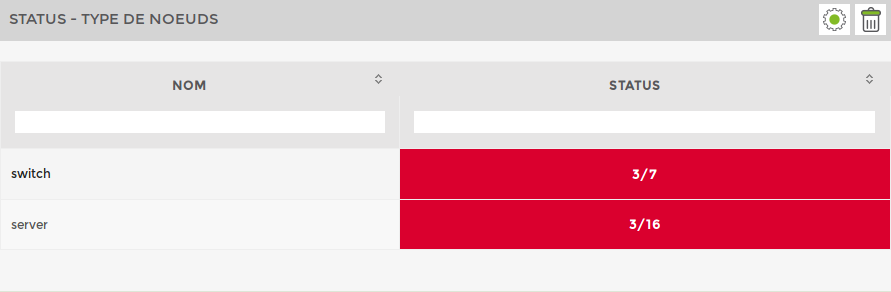
Example: for servers ⇒ 3/16 (3 services in critical and 16 services in Ok). <html><h4>3) Select the node types</h4></html>
Service
Service graphics
Here's an example:
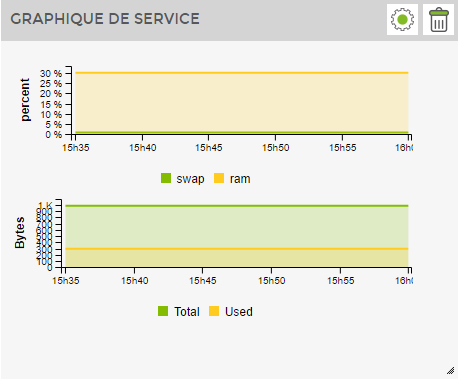
<html><h4>1) General settings and styles</h4></html>
By default, the display time is set to 30 seconds. It is not possible to go below this time.
<html><h4>2) Display settings</h4></html>

Set the period of the graph in minutes <html><h4>3) Link a node</h4></html>
Choose a knot and a service to display their respective graph via the drop-down list.
Service value view
Here's an example:
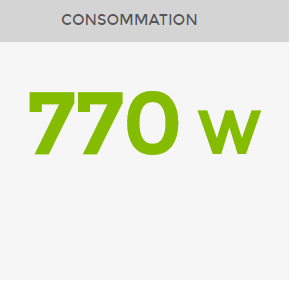
<html><h4>1) General parameters and styles</h4> </html>
<html><h4>2) Set the display parameters</h4></html>

Define the period of the graph in minutes, the unit depending on the service and taille de la police.
<html><h4>3) Tie a knot</h4></html>

Choose the nodethe service to link to the widget, as well as the value to display (if available).
Service gauge
Example: 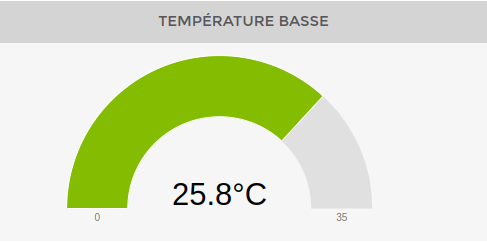
<html><h4>1) General parameters and styles</h4> </html>
By default, the display time is set to 30 seconds. It is not possible to go below this time.
<html><h4>2) Settings</h4> </html>

Define the period in minutes, theunit as well as the minimum and maximum value.
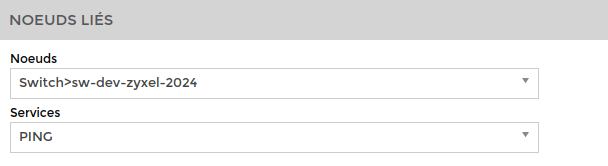
<html><h4>3) Linked nodes</h4> </html>
Choose the nodethe service to link to the widget, as well as the value to display (if available).
Applications
Application chain
Example:
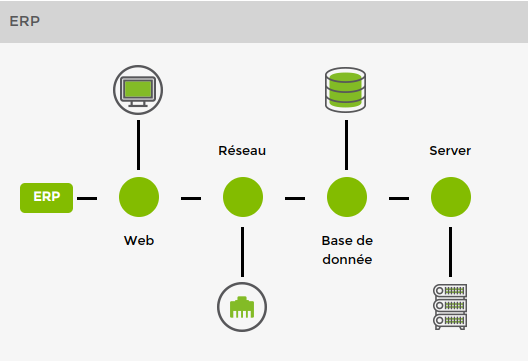
<html><h4>1) Add an application chain</h4></html>
Create a virtual nodedefine a name and set the duration. By default, the display time is set to 30 seconds. It is not possible to go below this time.
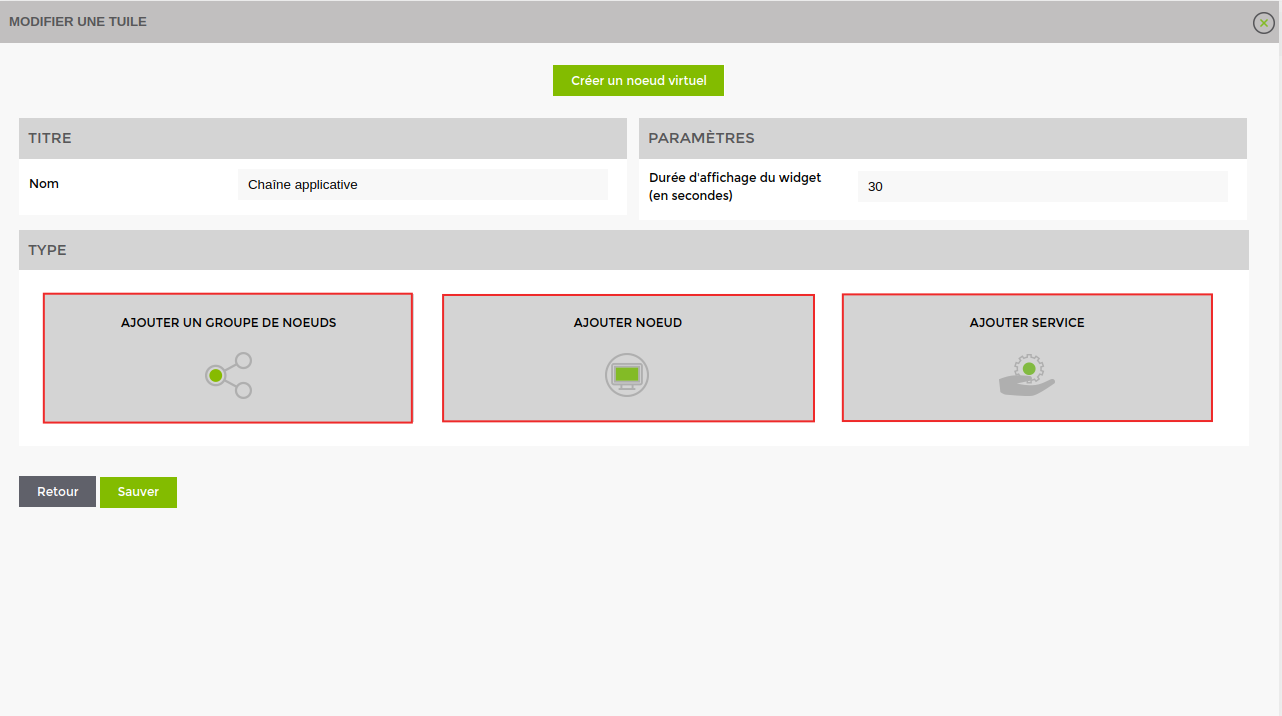
By clicking on a type, you add an element to the chain.
<html><h4>2) Add a type </h4></html>
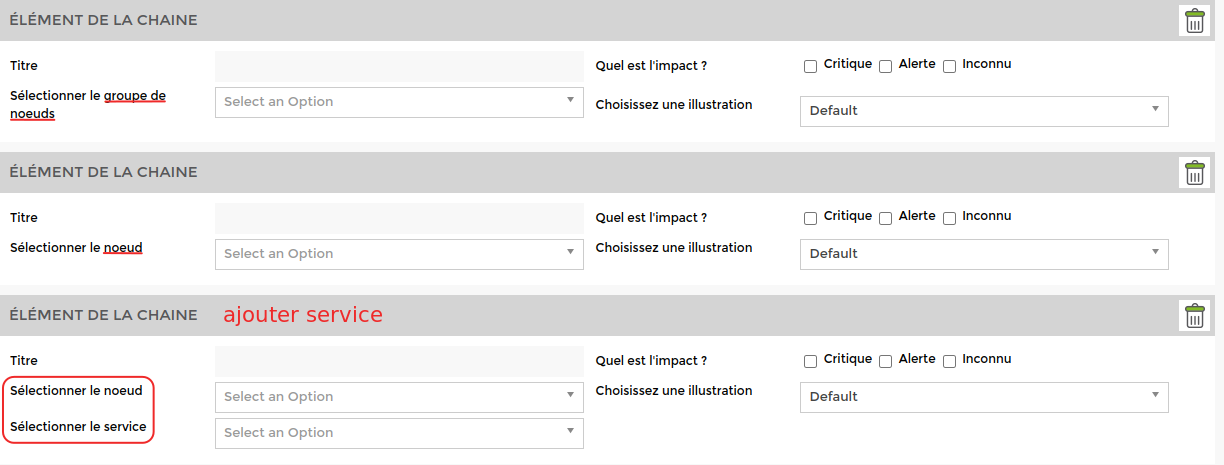
Give a title to the chain element and select the nodenode node group or the service you want to integrate. Then determine the impact on the chain from the three possible options: critical, alert or unknown.
Finally, choose an illustration from the default list. It is not possible to add your own illustrations.
Other
View linked to a plan
Example: 

By default, the display time is set to 30 seconds. It is not possible to go below this time!
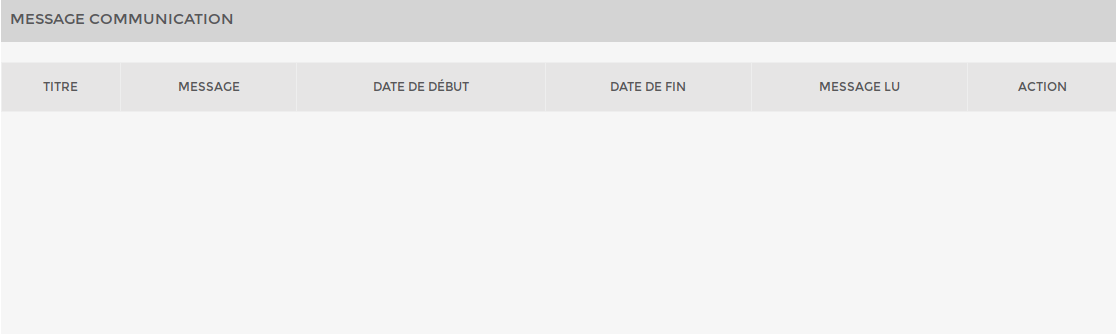
Communication message
Here's an example:
<html><h4>1) General settings and style</h4></html>
By default, the display time is set to 30 seconds. It is not possible to go below this time!
<html><h4>2) Choose a view</h4></html>
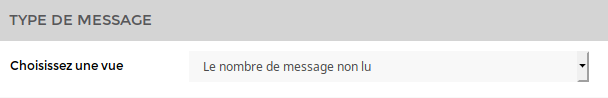
Choose whether you want to display only the number of unread messages or the message table. This table is the same as on the « Message communication ».

Logo
Here's an example:
![]()
<html><h4>1) General settings and styles</h4></html>
By default, the display time is set to 180 seconds. It is not possible to go below 30 seconds.
<html><h4>2) Choose an image</h4></html>
![]()
Select a pre-existing image from the list or upload a new one by clicking on « Charger nouvelle image ».
API - Galaxy - Alert
This widget is not useful for the Esia Unity.
It allows you to view current alerts from another esia server. It is the same widget as « Alertes en cours » but for the esia server of one of your partners.

<html><h4>1) General settings and styles</h4></html>
By default, the display time is set to 30 seconds. It is not possible to go below this time.
This section allows you to set the widget name, font size, title alignment and title colour.
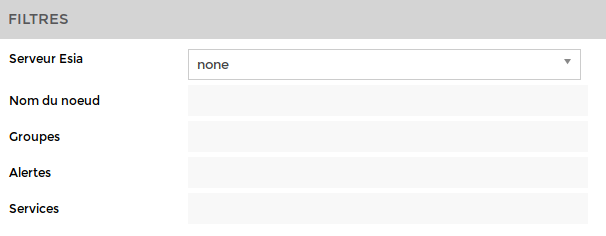
<html><h4>3) Filter alerts</h4></html> Select the Esia server for which you want to display alerts.
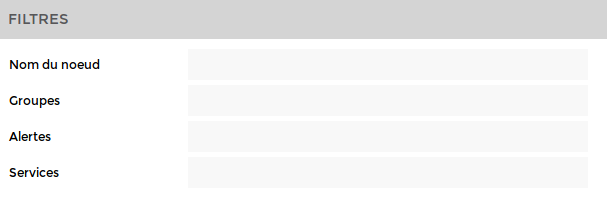
You can apply filters to display only alerts for a particular node or a group of nodes, …
Backup views
Example:

<html><h4>1) General settings and styles</h4></html>
By default, the display time is set to 180 seconds. It is not possible to go below 30 seconds.
<html><h4>2) Settings</h4></html>
Select the server and the period of the displayed status.
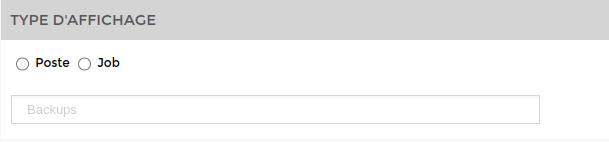
<html><h4>3) Types of display</h4></html>
Depending on what you want to display, choose “item“orjob”
Job corresponds for example to a zone, a city or a site (Paris, Brussels, Nantes, Antwerp…)
Job corresponds to a server located in a substation.
Current alerts
Example:
<html><h4>1) Settings and style</h4></html>
By default, the display time is set to 30 seconds. It is not possible to go below this time!
<html><h4>2) Display settings</h4></html>
You can choose to display the data in the screen above.
<html><h4>4) Filter alerts</h4></html> You can apply filters to display only alerts for a specific node or group of nodes, …