Table of Contents
The home page
The ESIA home page looks like this:
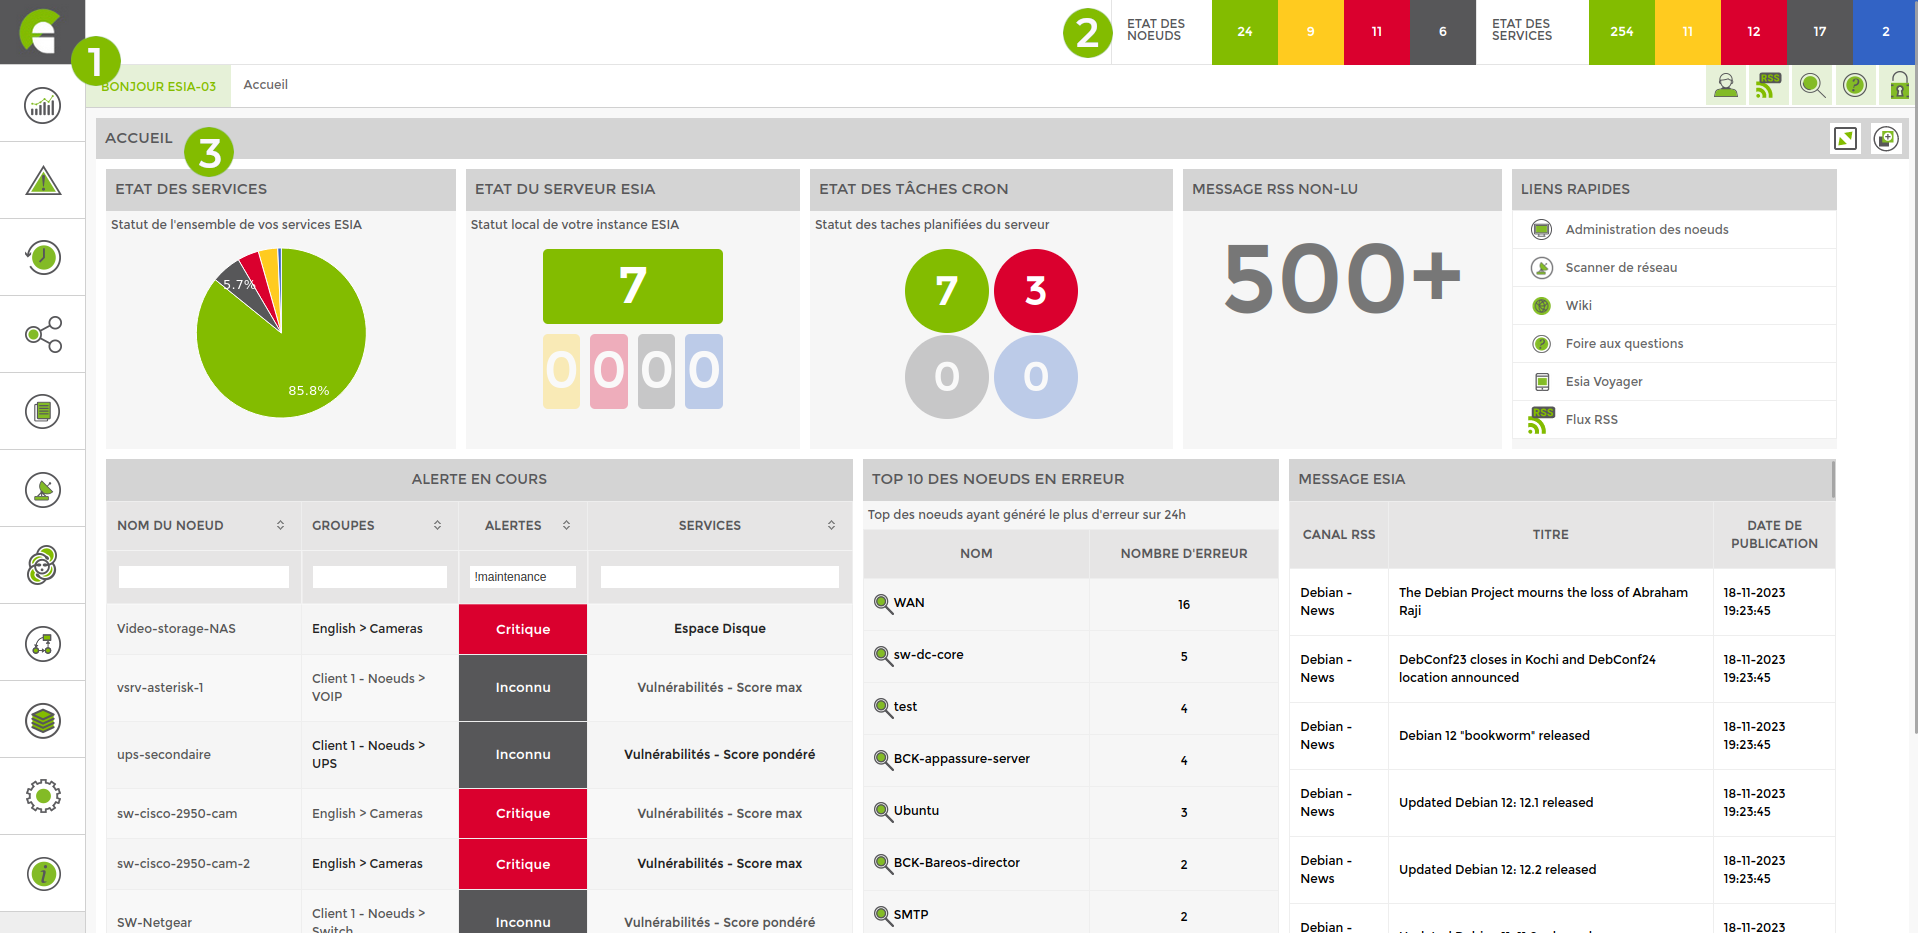
It contains all the following elements:
1. The vertical menu bar
This allows you to navigate through the ESIA interface and access :
- the menu for adding an ESIA Unity box
- Dashboards
- Current alert log
- Alert history
- Nodes
- Map module
- Reports module
- Import system (scans)
- Administration
2. Node and service status
This part of the interface lists all the nodes and services according to their status (OK, Alert, Critical, Unknown, Maintenance).
3. Home view
This view is a default dashboard; it can be duplicated and then modified from the dashboard menu.
It comprises the following elements:
- Service status : Graphical representation, as a percentage, of all Esia services in each status (OK, Alert, Critical, Unknown).
- Esia server status : Esia server status: representation of the number of services in each status for your Esia server node (Cloud or Enterprise).
- Cron task status : Status of scheduled tasks on your Esia Server. These are tasks that run in the background (for example a network scan).
- Unread RSS messages : Number of unread RSS messages.
- Quick links : Clickable links to different sections of your Esia or wiki.
- Current alerts : This table lists all current alerts on your Esia. You can quickly access the node concerned by clicking on the alerts.
- Top 10 error nodes : This table lists the nodes that have generated the most errors on your Esia over the last 24 hours. You can quickly access the node concerned by clicking on its name.
- Esia messages : List of the latest RSS messages received. You can read the full message by clicking on it.
en/intro/page_accueil.txt · Last modified: by 127.0.0.1